Of the total 69265.50 metric tonnes exported during April-January 2015-16, Kuwait was the largest importer with shipment of 10867.315 MT.
The Dollar Business Bureau
As per port-wise data, Mumbai JNPT topped with total shipment of 42392.869 MT against 173410 MT year-on-year, followed by Kandla (15030 MT) and Mundra (11842 MT).
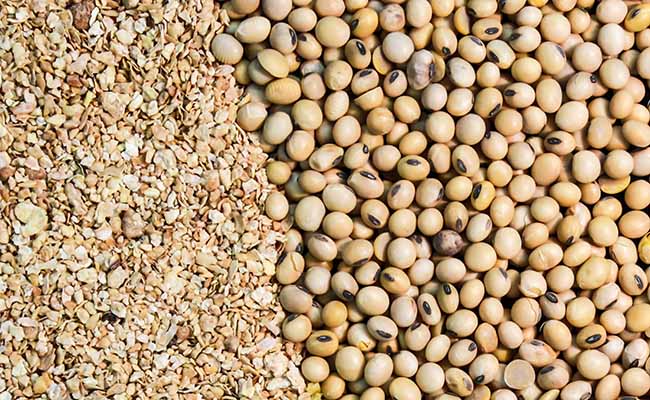
Export of Soybean meal witnessed 92.58% decline during January this year and reduced to 7,707 tonnes compared to 1.03 lakh tonnes exported during the same month of the previous year.
According to the Soybean Processors Association of India (SOPA), on the financial year basis, exports between April 2015 and January 2016 witnessed 87.06% decline compared to the figure of the same period a year ago. It was 69,266 tonnes during the period compared to 5.35 lakh tonnes year-on-year.
On the basis of the oil year (October–September), total exports during October 2015 to January 2016 stood at 26,520 tonnes as against 4.38 lakh tonnes last year, registering a fall of 93.95%.
As per SOPA’s country-wise data, of the total 69265.50 metric tonnes (MT) exported during April ’15-January’16, Kuwait was the largest importer with total shipment of 10867.315 MT, followed by UAE (9050 MT), Oman (7801 MT), Myanmar (7725 MT), Thailand (7535 MT), and Saudi Arabia (4480 MT).
Of the total 26 importers in the list, Netherlands (20,000 MT) stood as the least-imported export destination for Indian soybean meal.
During April ’15-January ’16 period, Bahrain imported 3055 MT of soy meal from India during April-May last year. But the country remained inactive in terms of fresh import order after May 2015. Same was the case with Cambodia (1673 MT) and Myanmar (7725 MT). However, Myanmar showed some revival in demand in January this year after a recess of seven months.
As per port-wise data, Mumbai JNPT topped with total shipment of 42392.869 MT against 173410 MT year-on-year, followed by Kandla (15030 MT against 446013.000 MT y-o-y) and Mundra (11842 MT against 8867.196 MT y-o-y).
February 08, 2015 | 4:04pm IST.