
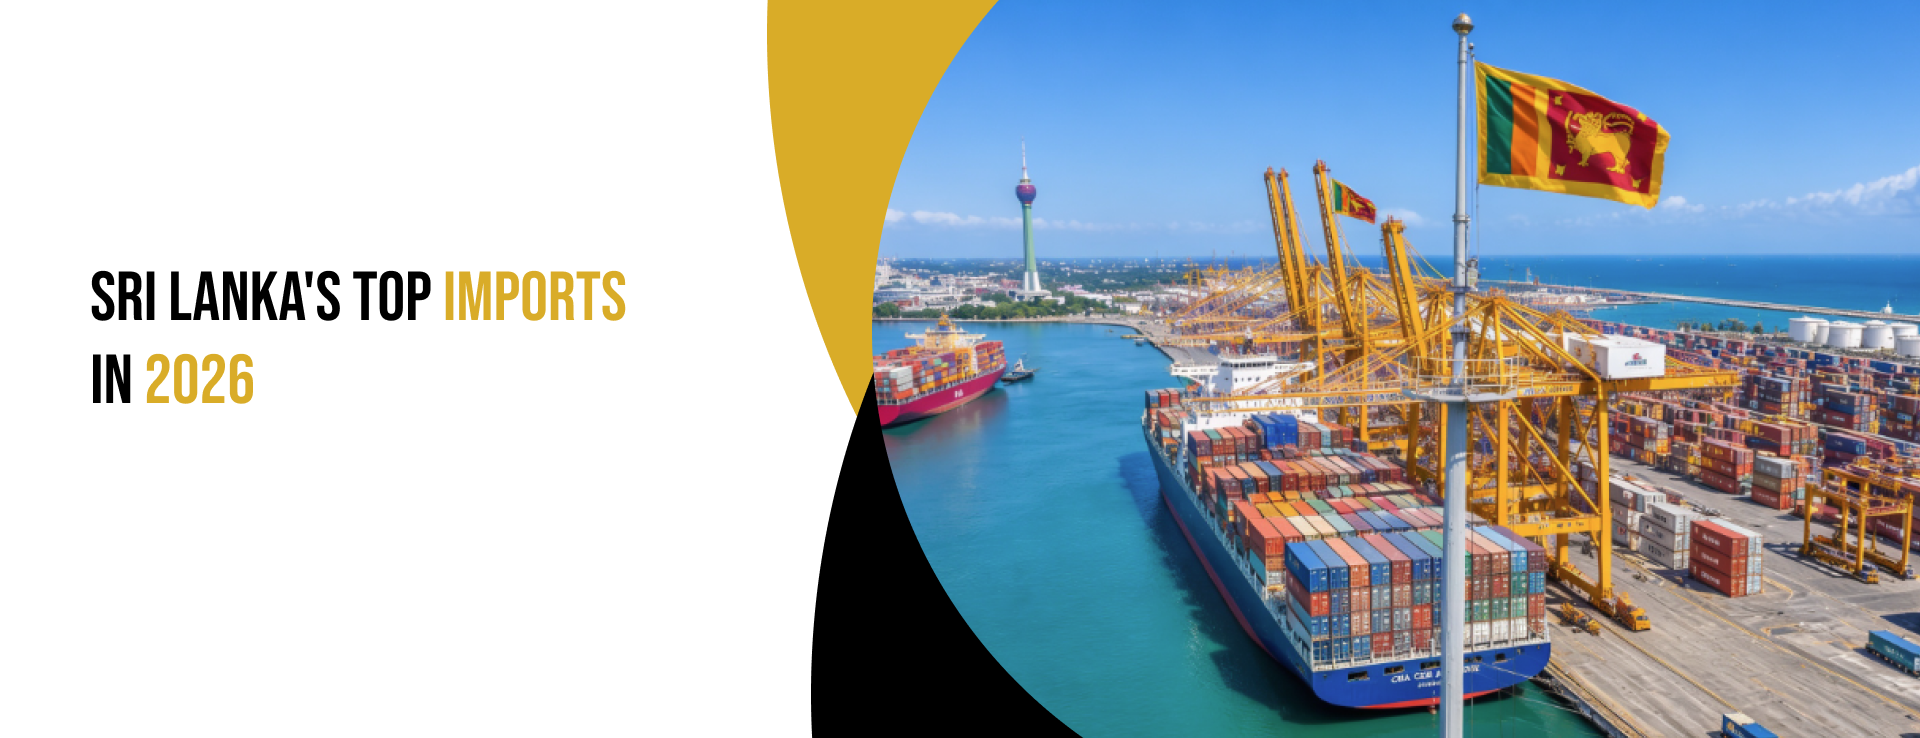

What Does Sri Lanka Import the Most in 2026?
Sri Lanka spent over $20 billion on imports in the last twelve months, to be exact, from April 2025 and March 2026. That number alone tells a story but the most interesting one lies in the details like which products, from which countries, in what volumes, and what that reveals about where the economy is right now.
Import data isn’t just a list of purchases. It highlights the supply gaps and tells how an economy is structured. Sri Lanka's imports in 2026 reflect these three things: continued energy dependence, industrial rebuilding, and recovering consumer activity. Each import category reflects a different pressure point in the economy.
Looking to analyse Sri Lanka trade data or explore business opportunities here? The best thing to start with is understanding the country's import profile. The top import products list of Sri Lanka reveal emerging opportunities, shifting demands, and much more crucial things. So, let's understand more!
Get Access To Sri Lanka Trade Data
Top 10 Import Products of Sri Lanka (April 2025 - March 2026)
The table below shows the top import products of Sri Lanka based on the EX-IM shipment data from April 2025 to March 2026. These categories dominate the country’s import spending and reflect key economic drivers
| HS Code | Description | Value (USD) |
| 27 | Mineral fuels and petroleum products | $2.78B |
| 87 | Vehicles and automotive parts | $2.38B |
| 84 | Industrial machinery and mechanical equipment's | $1.51B |
| 60 | Knitted and crocheted fabrics | $1.46B |
| 85 | Electrical equipment and electronics | $1.16B |
| 39 | Plastics and plastic products | $681.83M |
| 72 | Iron and steel | $623.81M |
| 10 | Cereals (Wheat, Rice, Maize, etc.) | $608.45M |
| 52 | Raw cotton and cotton products | $542.93M |
| 30 | Medicines and pharma products | $524.75M |
Energy is Still the Biggest Dependency
Mineral fuels (HS Code 27) remain Sri Lanka's single largest import at $2.78 billion. Energy imports at this scale tells that transportation, manufacturing, and power generation are all operating on imported fuel. Since there are limited domestic substitutes currently in Sri Lanka, every time when global price shifts Sri Lanka's import bill moves with it. This kind of exposure to external price volatility creates real budget pressure for the government as the country is strongly tied to global energy markets in a way that's difficult to unwind quickly. Sri Lanka has shown policy intent in renewable energy infrastructure to reduce import dependency but trade data makes clear that fuel imports remain dominant today. Though it's also true that transition in this space will take years to control on import volumes.
Industrial Growth Through Better Machinery
Sri Lanka import products under HS Codes 84 and 85 accounted for more than $2.67 billion combined. The HS code 84 is for machinery and mechanical equipment whereas the HS code 85 stands for electrical equipment and electronics. The presence of these categories among the top import products of Sri Lanka suggests that industrial activity is picking up, not contracting. Developing nations for example Sri Lanka rarely start by just selling things, they start by importing first to build their own productive capacity. By bringing in this high-tech equipment, local manufacturers are signaling that they are upgrading their production lines and preparing for a more automated, efficient future.
The Apparel Industry and Global Links
Sri Lanka’s textile industry is a part of its high-value export sector. But interestingly, they are also a major part of the top import products of Sri Lanka. The massive amount of knitted fabrics (HS 60) and raw cotton (HS 52) imports alone exceed $1.5 Billion. This clearly shows how export-driven manufacturing actually works. These aren’t just "purchases"; they are essential raw inputs that get transformed into high-value exports, proving that the country’s manufacturing strength relies on keeping these supply lines active and healthy. For anyone trading in fabrics, fibres, or textile inputs, Sri Lanka is an active and consistent buyer.
Consumer Demand and Rising Mobility
The import data for vehicles (HS 87) and electronics (HS 85) shows rising demand for both consumers and businesses. Vehicle imports don't just reflect personal consumption but also represent business investment. Delivery fleets, logistics operators, construction companies, and commercial transporters all buy vehicles. Electronics also follow a similar pattern. Together, these two categories show that Sri Lanka imports 2026 aren't purely about survival commodities - there's genuine demand recovery happening in discretionary and semi-discretionary categories.
The Non Negotiables: Food and Health
Some products in this list are less about “growth” and more about stability. The steady import of cereals (HS 10) and medicines (HS 30) highlights the government's focus on basic human security. These categories rarely fluctuate based on speculative market trends because they are fundamental needs. They are the most essential part of the import list, ensuring the population meets the needs and stay healthy regardless of the broader economic conditions.
Industrial Growth is Driving Demand for Basic Materials
Iron and steel with HS code 72 at $623.81 million and plastics with HS Code 39 at $681.83 million shows that construction and manufacturing are still in buzz. Their combined presence in the top import products of Sri Lanka is a reasonable indicator that construction and manufacturing activity is ongoing at a meaningful scale. Infrastructure investment tends to pull both categories simultaneously. A port expansion needs steel for structure and plastics for fittings, pipes, and components. A commercial development does the same. The fact that both sit comfortably in the top ten suggests that capital investment projects are active, not paused.
Wrapping Up
The top import products of Sri Lanka reveal more than trade volumes, they reveal priorities. Together these imports tell a balanced story of dependence, growth, and transformation across sectors. And for anyone doing business in Sri Lankan markets, understanding what flows in is just as important as understanding what flows out.
If you’re looking to identify buyers, track shipment trends, and uncover emerging opportunities in Sri Lanka, accurate Sri Lanka import data is what makes that possible. With EX-IM By The Dollar Business you get access to shipment-level trade intelligence - real supplier names, buyer details, HS code breakdowns, and trend data - so you can make decisions based on what's actually happening, not guesswork. Book a demo now to make informed decisions!
Frequently Asked Questions
1. What is Sri Lanka's largest import in 2026?
As per EX-IM trade data the largest imports in 2026 for Sri Lanka are mineral fuels and petroleum products at $2.78 Billion followed by vehicles and automotive parts at $2.38 Billion.
2. Where can I get Sri Lanka import export data?
You can get accurate Sri Lanka import export data in legit trade intel platforms like EX-IM By The Dollar Business. You get access to details like real time shipment records, buyer and seller information, trade trends, and much more.
3. Why does Sri Lanka import so much fuel?
Sri Lanka imports large volumes of fuel because domestic energy production is limited and cannot fully meet national demand.
Recent Blogs
India’s Import Export Data: Everything You Need to Know in 2026
Trade data isn't just numbers Discover how Indian businesses use importexport data to find buyers track competitors and much more in 2026
CIF vs FOB vs EXW Explained for Beginners
CIF vs FOB vs EXW explained for beginners learn what each Incoterm means who pays for what and when risk transfers in international shipping
Trade Myths vs Reality: What Every Exporter Should Know
Trade myths vs reality: discover the truth about export profits pricing market expansion and how import export data can guide your export strategy