Govt inaugarates Enhanced Foreign Trade Data Dashboard
The Dollar Business Bureau
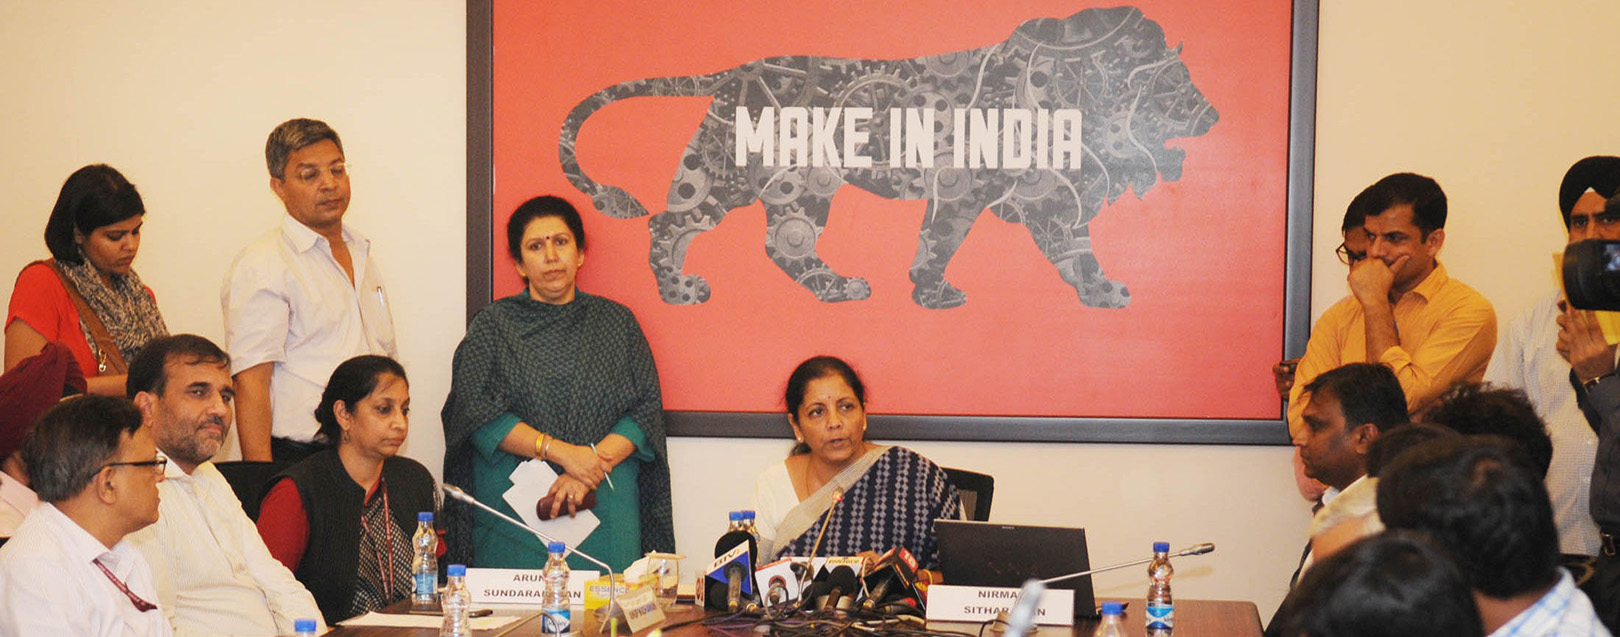
As part of the initiative of the Ministry of Commerce & Industry to provide easy access to the public with regard to India’s export, import and balance of trade data in an analytical format, over time and space, Commerce & Industry Minister Nirmala Sitharaman on Sunday launched a new enhanced Dashboard on Foreign Trade Data. Speaking on the occasion she said technology will be used for transparent decision making and reaching out to people using real time data. The Minister said this Dashboard is an improved version of the earlier EXIM Analytics Dashboard developed with many added features. It is more user friendly and would facilitate the general public to have an accurate picture on dynamics of foreign trade performance of India.
The new Dashboard gives a graphical collection of exports, imports and balance of trade of India; e.g., the Export turnover of the country – how it performs over time and space? What are the export destinations? What items are being exported? Which are the ports – inland, sea or airports from which the exports are taking place? The new interface is broadly divided into Exports, Imports and Balance of Trade views. Each of these views provide the user with features to inspect the trade that happens between India and a particular country, zoom into the activities of a particular port and reflect trade pattern over any months of the user's choice.
The Import view gives a sharp perspective of how India's imports have changed compared to the previous year. The user may also observe how the import value has fared across the months of that year. The Top Commodities and Ports section details the top 5 commodities and ports, in addition to the ones at the lower end. The clickable world map reflects the performance of India in imports to rest of the world. The darker the country shade, the higher the import from it. The flow diagram to the right of the world map will visualise what percentage of the top commodities have been imported from the various ports (thickness of the line reflects the magnitude).
If users are curious to see how their selected choices were to behave in the Exports area, they merely need to click on the Export view on the top navigation bar. Similarly, when users switch to the Balance of Trade view, they can see a world map detailing countries with positive/negative balance of trade with India. Countries can be sorted by Import value and the corresponding value of Export trade. Visual comparison of import-export trade values over the years is also available. Touching a monthly value in Trade Performance would highlight corresponding value in the Balance of Trade performance chart as well, making it easy to understand India's position on Balance of Trade (BoT) in that month compared to the previous months.
Digitisation of the government records and data analytics is also crucial for fast and effective evidence based planning and policy evaluation. This has an important role to play in effective and transparent governance. The Dashboard would provide an enabling environment to importers and exporters to identify and access global trade opportunities based on reliable and updated information, directly accessible to the public through Government sources.


 to success.